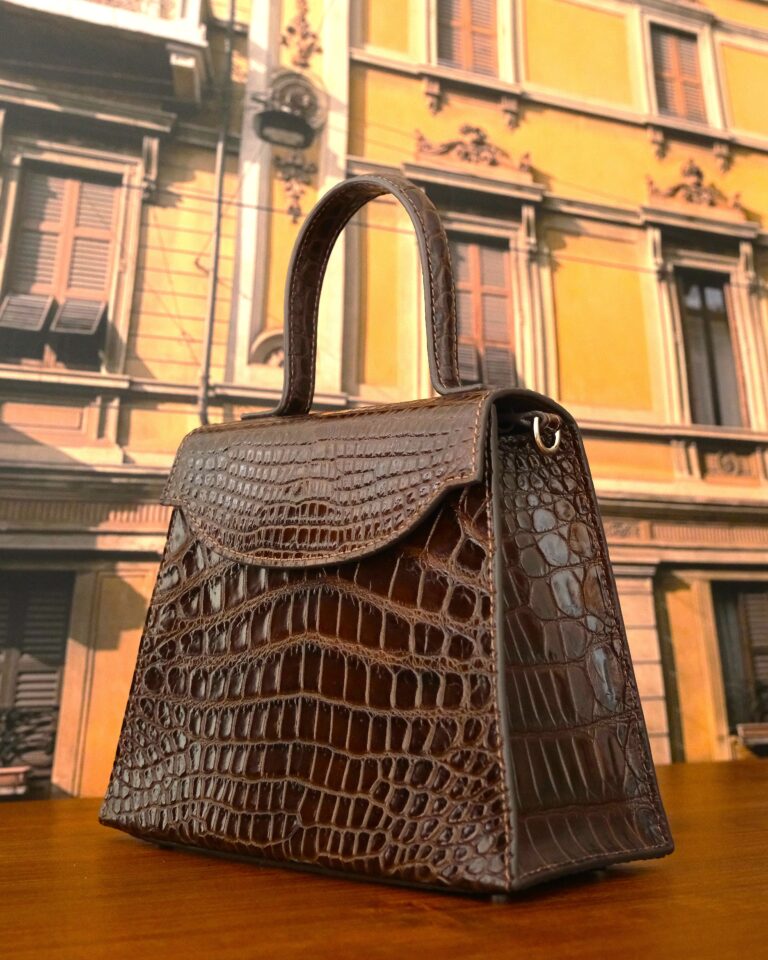
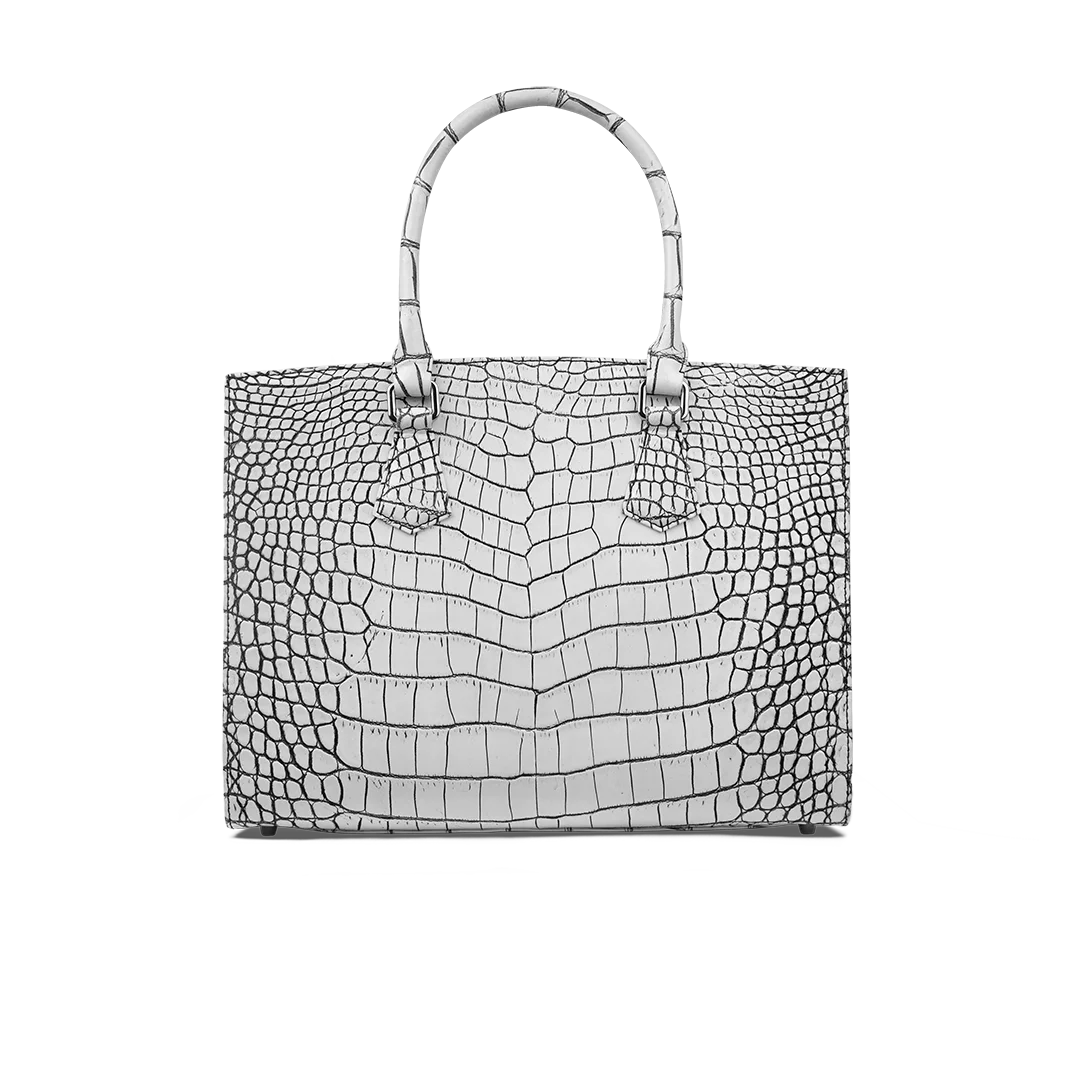
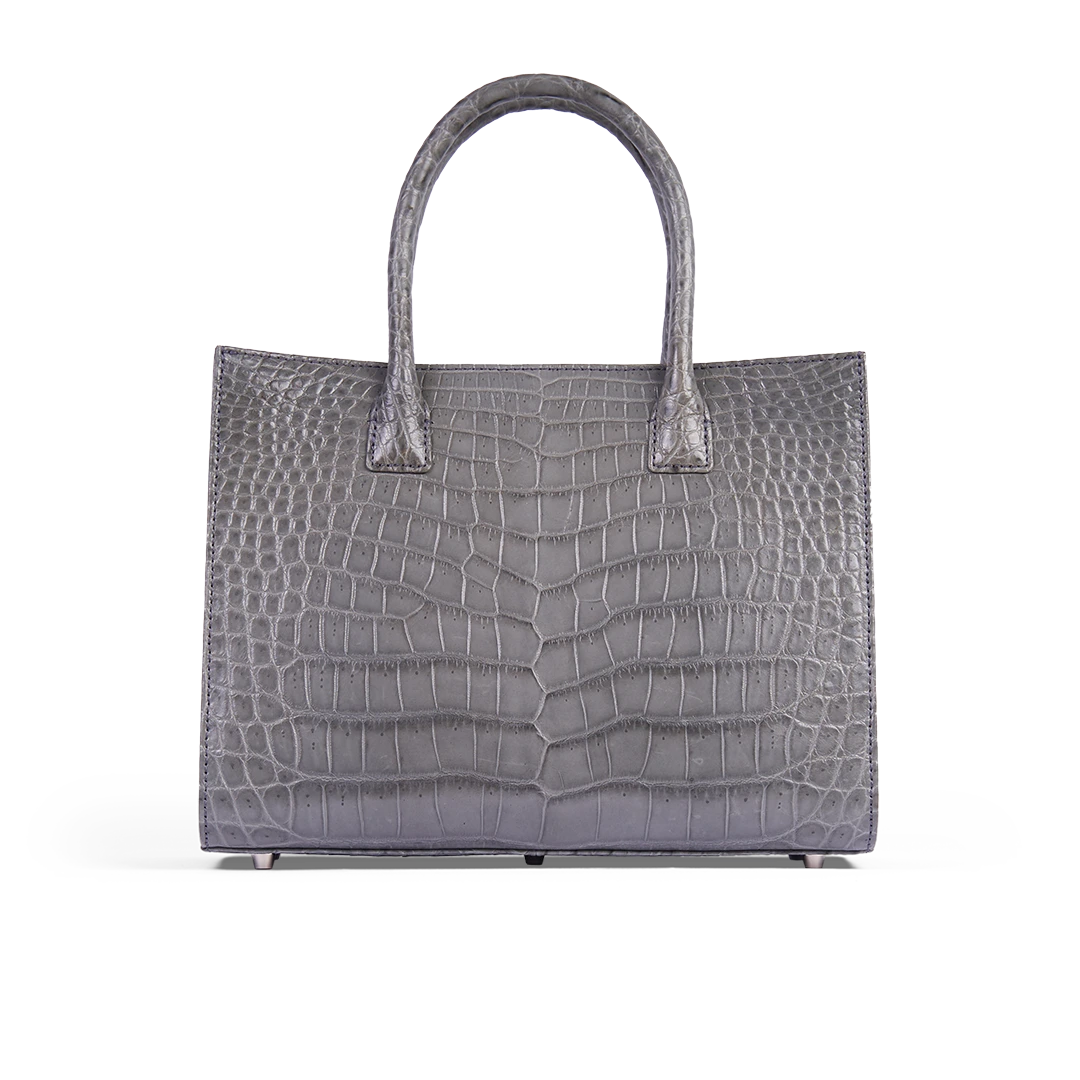
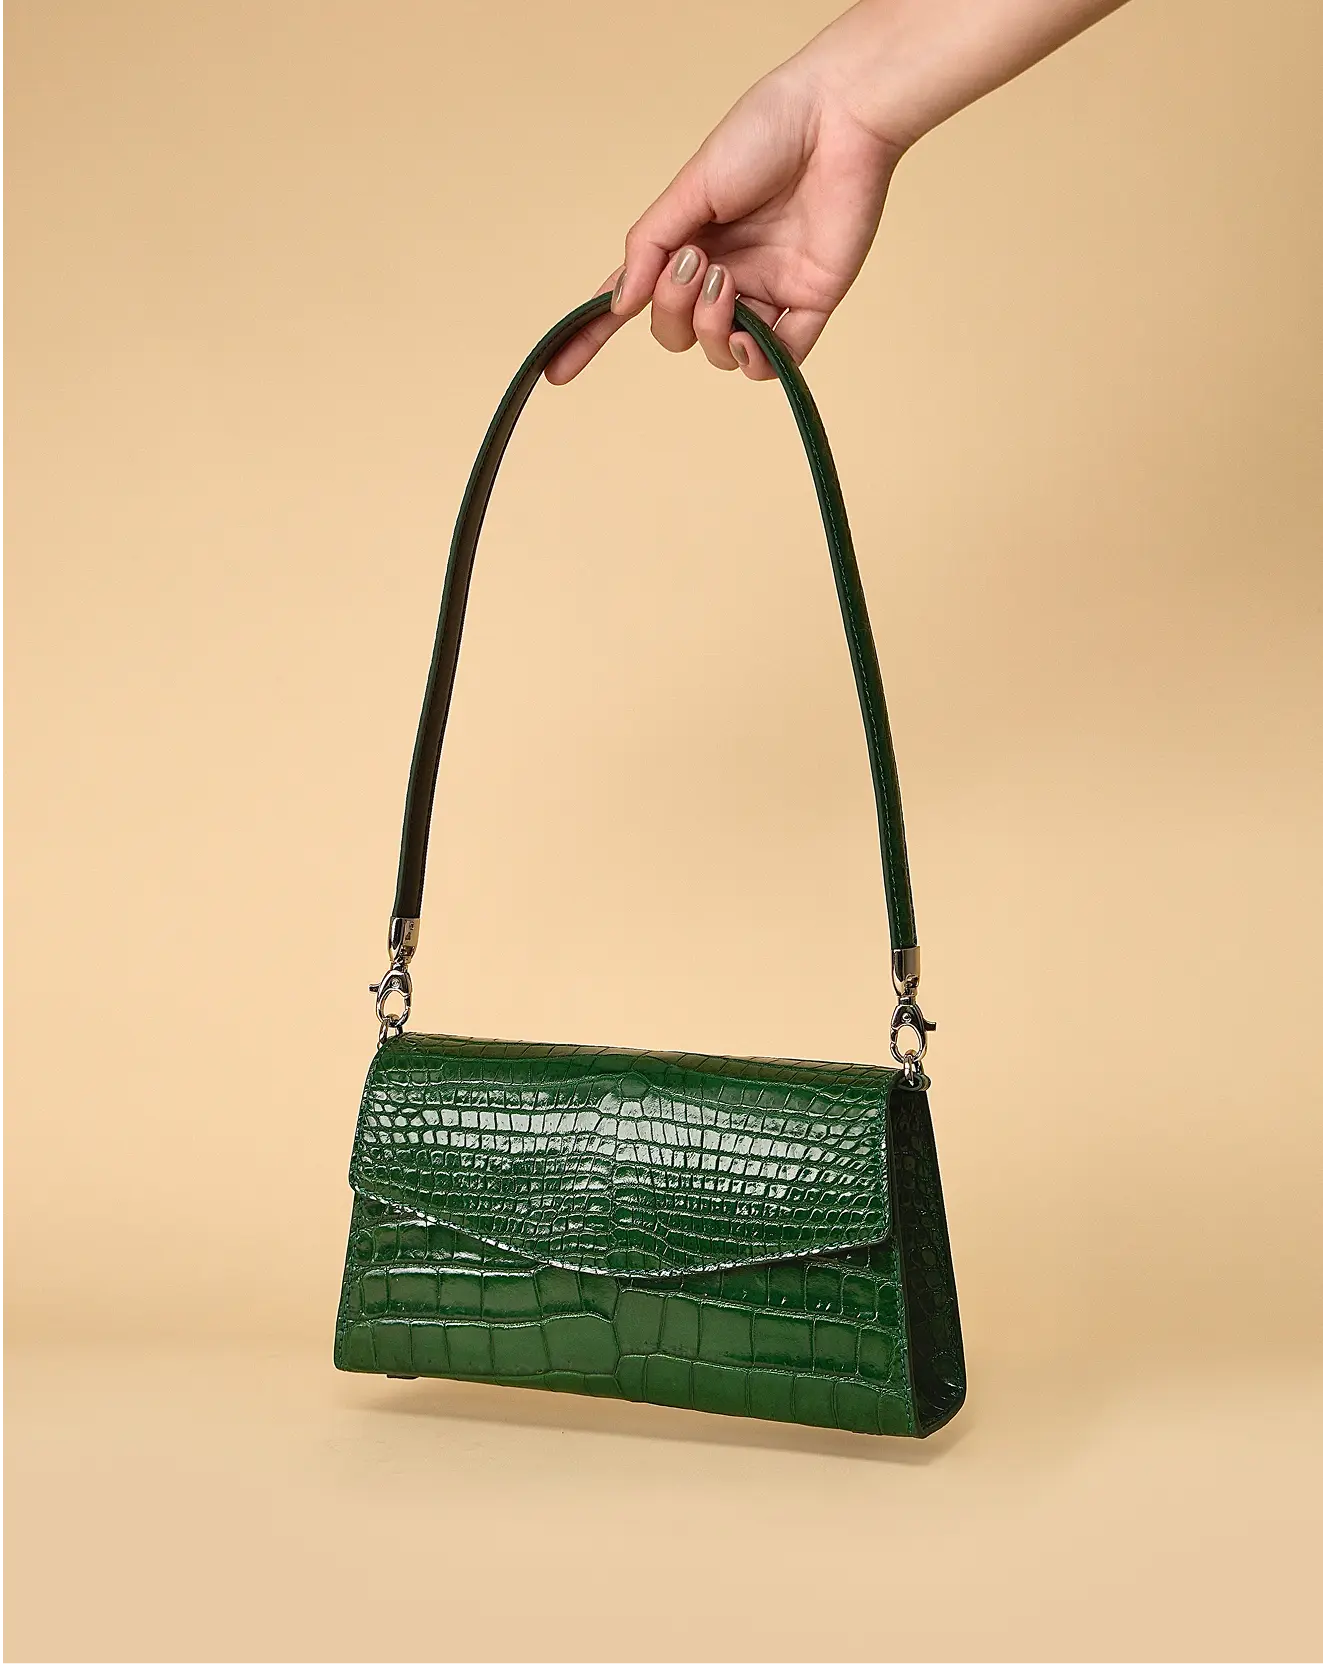
ICONIC TOTE BAG
Explore the finest iconic collection of Viet Thanh crocodile bags where we stand with our commitment towards elite craftmanship bringing you top-tier quality with effortless elegance reflecting via skilled artisan and colorful leather vibrance of European tanning technique.
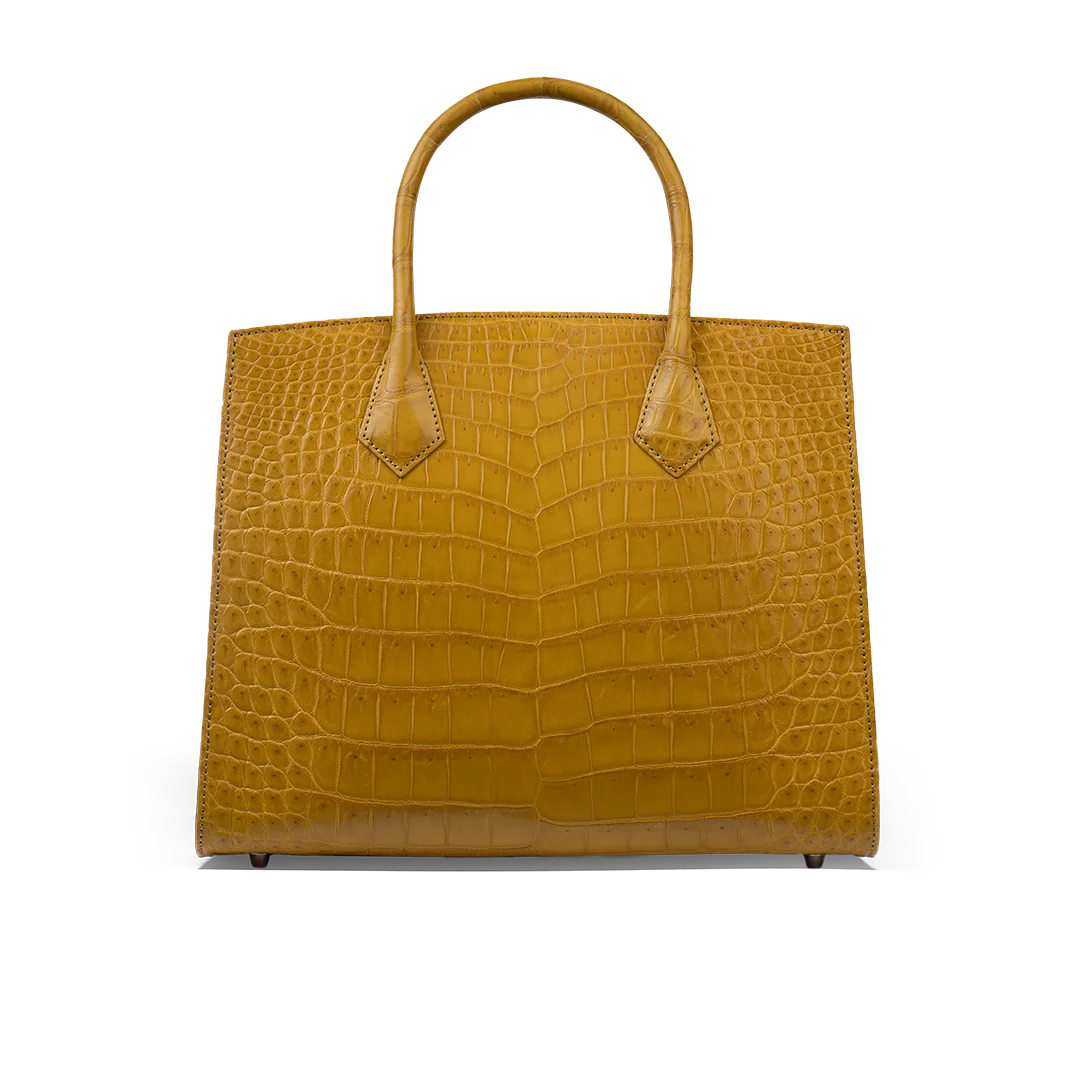
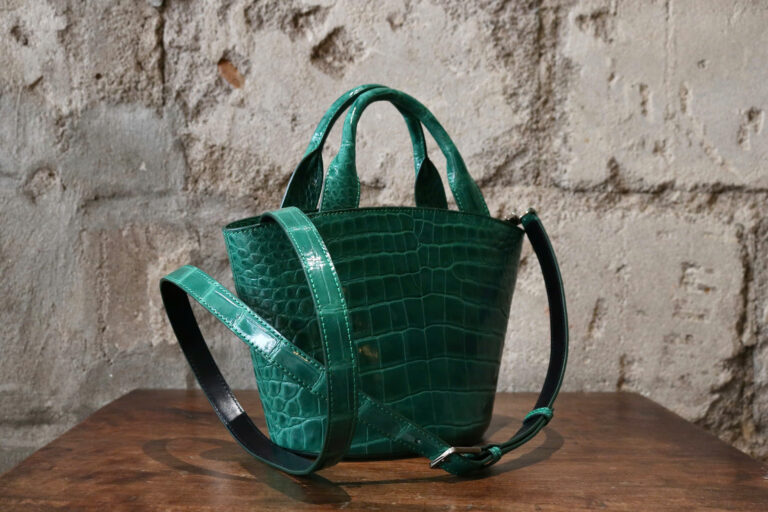
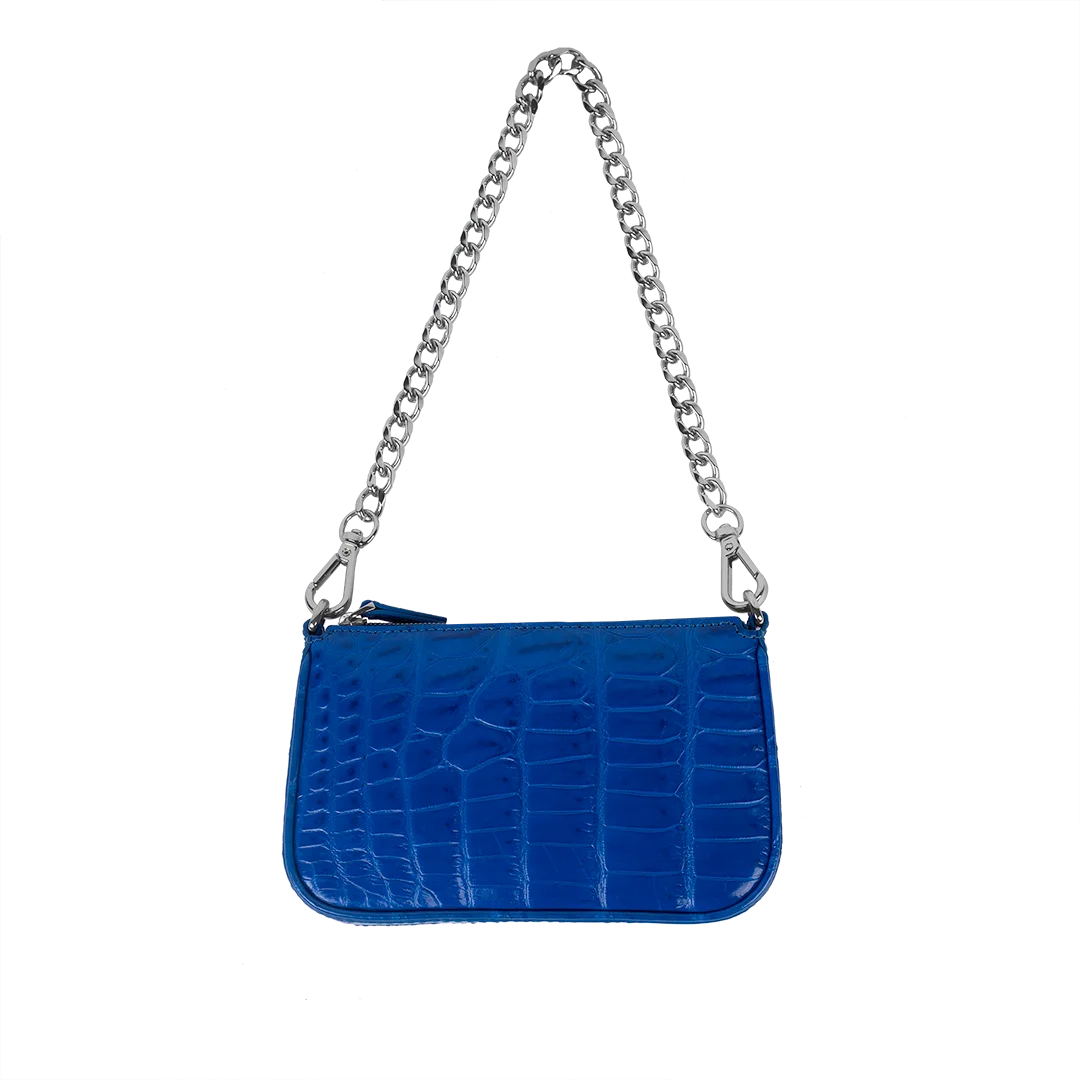
WEARABLE BAG
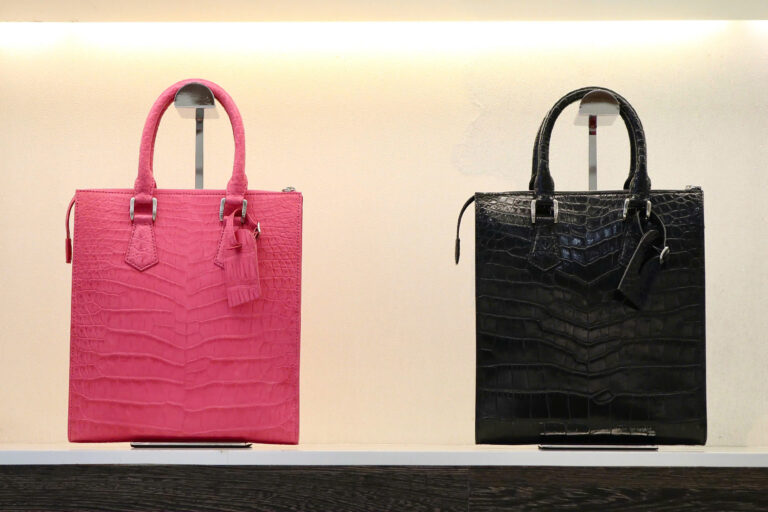
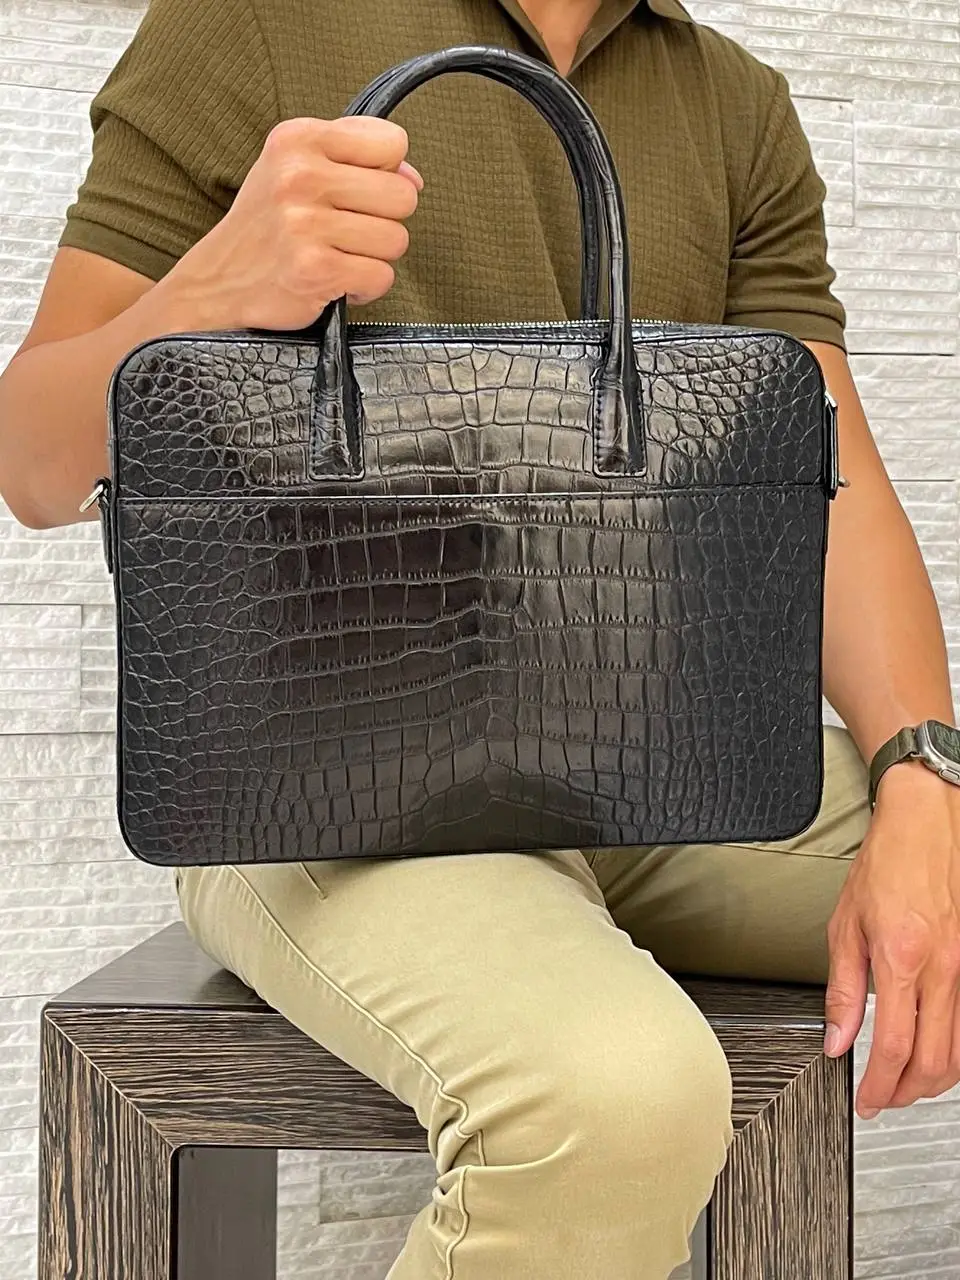
BUSINESS PROFILE BAG
At Viet Thanh Crocodile Company, we thrive to cover every aspect that brings to the world the finest of genuine crocodile leather accessories craftmanship. We work with local Italian designers and credible European tanning material suppliers to truely intertwine elegance and quality. In a world of fast pace and busy projects, our timeless genuine crocodile leather paragon brings nostalgic grace of classical design and coping with modern lifestyle.
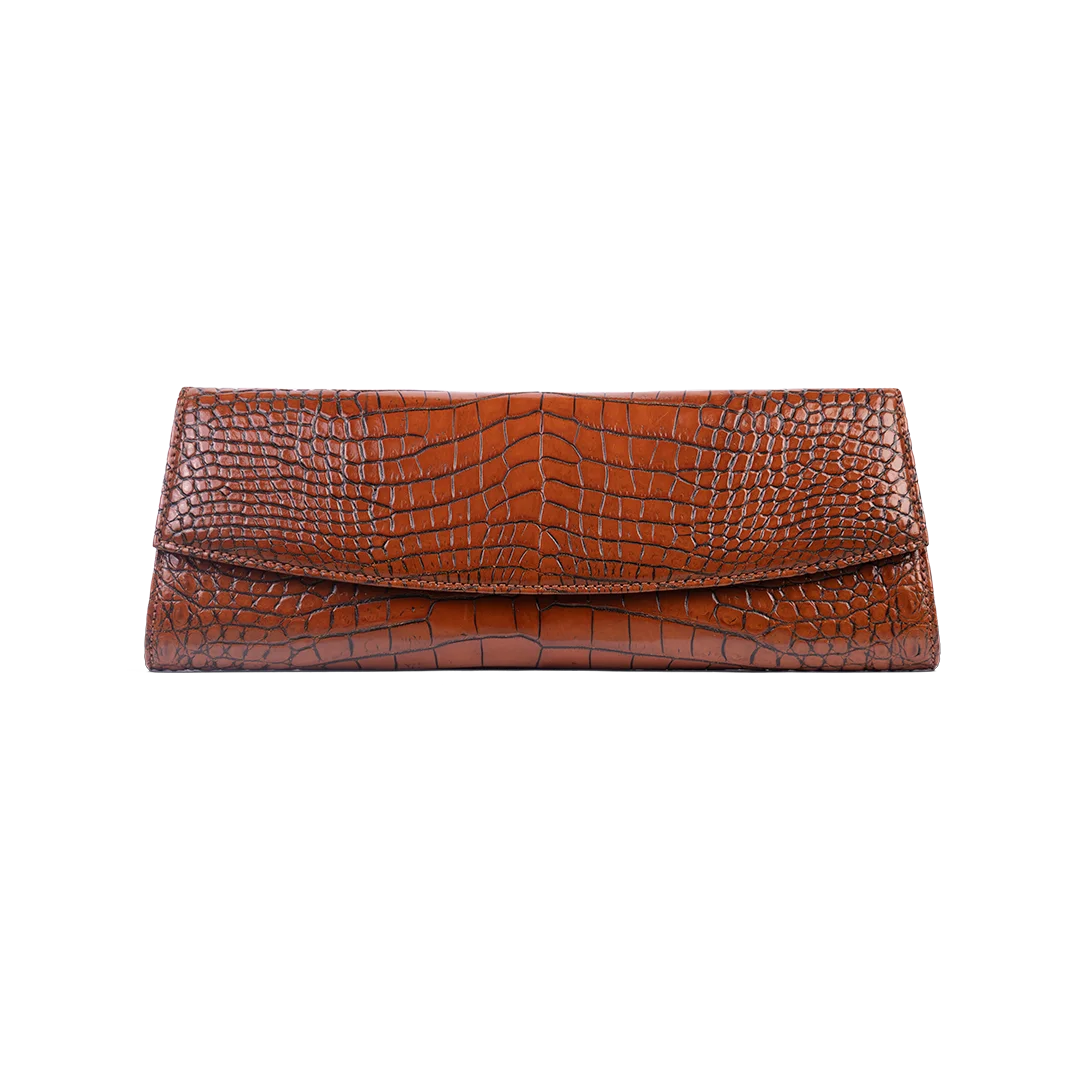
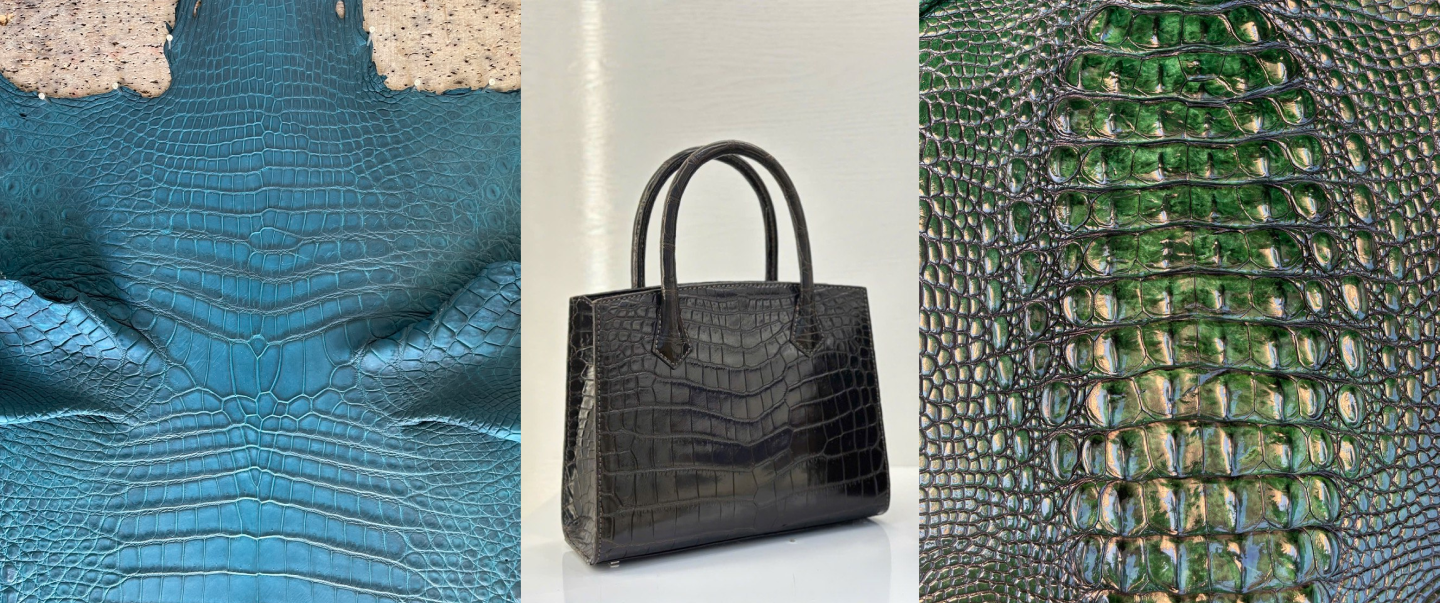
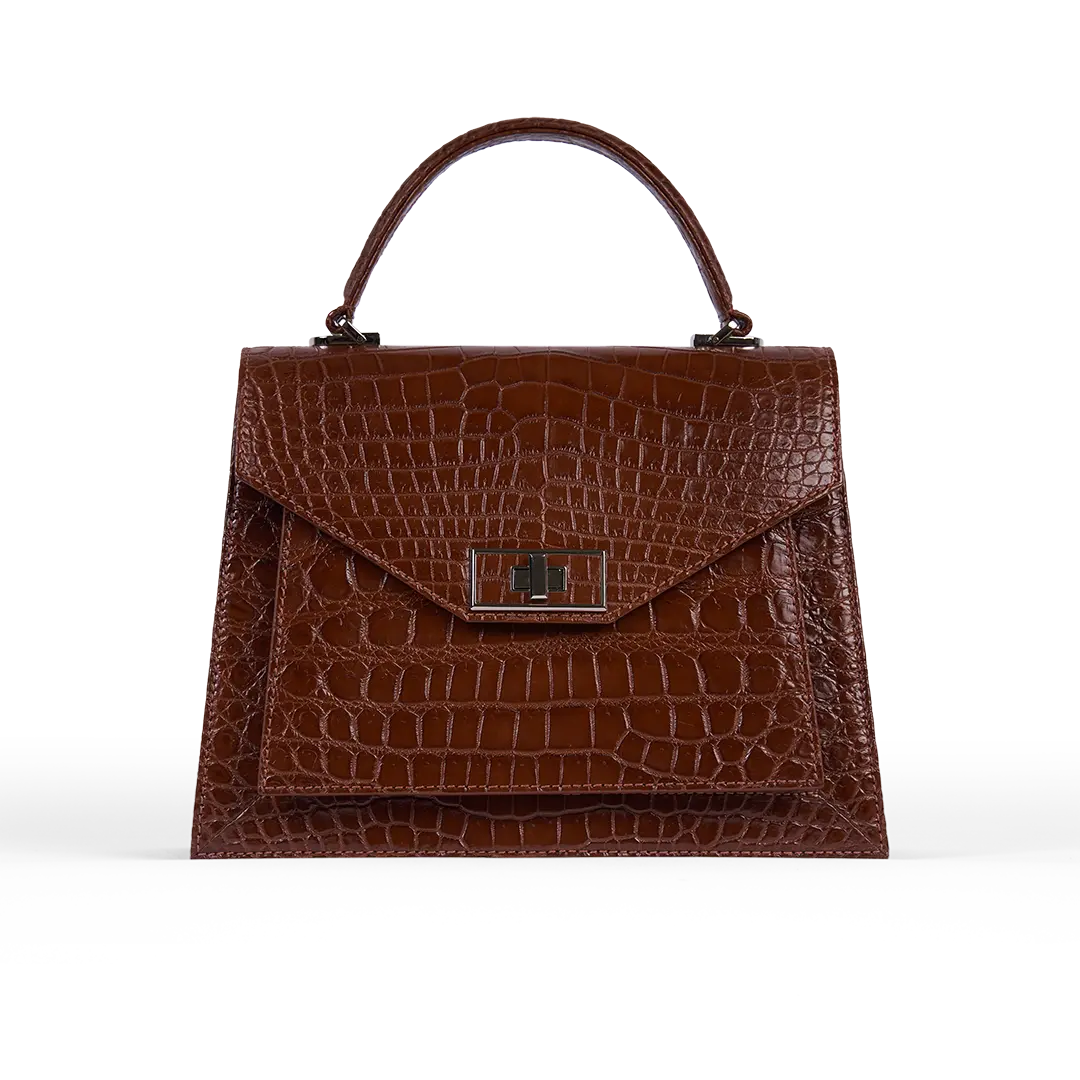
Viet Thanh Crocodile Premium Crocodile Leather
Viet Thanh Crocodile offers premium crocodile leather products, combining 30+ years of craftsmanship with advanced tanning techniques and European standards. Our crocodile leather is durable, naturally textured, and finished to a premium standard, ideal for luxury goods like handbags, wallets, belts, and accessories. Combining traditional craftsmanship with modern techniques, Viet Thanh Crocodile meets both local and international standards.
Shop Viet Thanh Crocodile Collections